There are certain things you need to know before starting to cruise timber. The forester must know the various timber products, size specifications and markets. Timber products include pine pulpwood, pine sawtimber, pine poles, pine chip-n-saw, hardwood pulpwood and hardwood sawtimber with different size specifications for each of the products.
Sawtimber
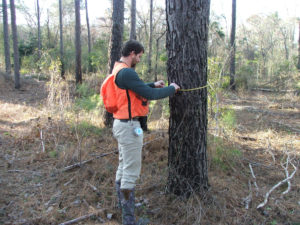
Hardwood sawtimber can be subdivided into an enormous variety of products themselves. The trees are measured at 4.5 feet from the ground (DBH) with the diameter tape. This measurement is referred to as diameter at breast height or DBH.
The next measurement is the height. In sawtimber, the trees are broken into logs or 1/2 logs, with a log being 16 feet in length (32’ in the west). We use a clinometer to help determine the height.
Quality is also measured. If the tree is too rough but large enough to be a log, the tree may still be pulpwood. Defects like forks, crooks, knots, ring knots, hollows, disease and various other problems can cause sawtimber to be culled into pulpwood. Pulpwood is measured to total height or to a certain diameter top depending on the particular market.
After all the data is acquired the volume is computed into some type of units. The unit can be cords, tons, thousand board feet (MBF), cunits, etc. The form class must then be determined, which is basically the amount of taper in the tree. The more taper in the tree the less board feet you get out of the tree. The average tree is form class 78. Trees with more taper will be around 74 and the closer to a perfect cylinder the trees are, the higher the form class, around 80 to 82.
There are mostly three log rules used or ways to figure the board feet per tree. These log rules are:
- Scribner – most common in the south for pine timber.
- Doyle – commonly used for hardwood, gives more board feet for smaller trees.
- International – not commonly used in the south, most generous in regard to number of board feet per log.
The trees are tallied on tally cards in the proper diameter and height location. Sometimes each plot is tallied on separate cards and numbered so they can be analyzed statistically. This is in case the timber cruise should need to be audited later. Timber cruise audits are common on larger inventories. Audits on smaller tracts are not common.
Plot size is very important as to how many plots are used and what grid pattern is used. Plot size commonly varies from 1/1,000th acre plots to 1/4 acre plots. Plots are usually circular and all trees are measured within the given radius of the plot. Each plot size has a radius measured from the designated plot center. For example a 1/10th acre plot has a 37’ 2.8” radius and all trees within that radius are tallied. If a tree is on the line, the first tree is measured and the next tree skipped and alternated thereafter. Many times the less valuable pulpwood trees are tallied on a 1/10th acre plot and the more valuable saw timber trees are tallied on a 1/5th acre plot, giving the inventory a larger sample of the more valuable trees.
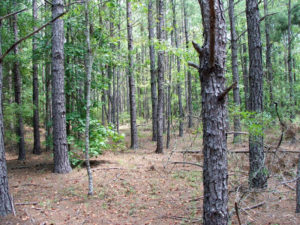
To get a good unbiased sample, cruise lines should be run across the drains and ridges. Typically, the timber is better in the bottoms or valleys and more sparse and smaller on the hills or ridges. To get an accurate sample of the timber, it is necessary to cross the drains and ridges to get an even or true representation of the timber.
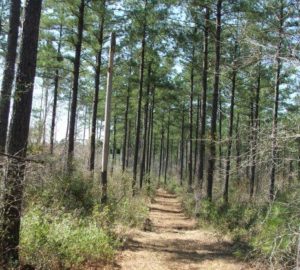
If all the plots were taken in the good timber in the more fertile bottom, you would overestimate the timber volume and misvalue the stand. If the stand is very evenly distributed with the same size timber, like a planted pine plantation, fewer plots would be needed to get an accurate sample. Timber stands with mixed pine and hardwood pockets of varying sizes would need a much more intense inventory to provide an acceptable confidence level. Some high value stands are 100% cruised or inventoried. Every single sawtimber tree is measured to be sure that the inventory is absolutely accurate. This type of inventory is very expensive and in most cases cost prohibitive.
There are several types of timber inventories or cruises.
- line plot
- prism
- strip
- 100%
- combinations of the above
It is possible to do some inventory from aerial photos; however, the accuracy is somewhat inconsistent.
Depending on the consistency of the timber stand, the forester will need to tailor the inventory to be sure he/she gets a good sample. If the plots or strips are not distributed throughout the timber stand properly, the inventory will not have a good sample and be incorrect.
Line Plot Cruises
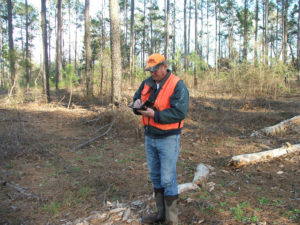
Line plot cruises are probably most common. The forester will lay out a grid and follow a compass bearing. Every so many chains, the forester will take a sample plot. A chain is 66 feet in length. The forester paces the distance and is surprisingly accurate. A pace is two steps.
At the end of the line, the forester turns 90 degrees and chains over to where the next line begins. At this point, another 90 degree turn is taken and the forester will begin taking sample plots back the other way. A grid of sample plots is taken over the entire tract. Some common grids are 2 chains by 5 chains, 3 chains by 3 chains, 4 chains by 4 chains, and 2 chains by 4 chains. On extremely large tracts the grid spacing can be 10 chains by 20 chains or larger.
Prism Cruises
Prism cruising is conducted in the same manner except the trees in the plot are determined in or out of the plot by looking through a prism from the plot center. There are several different factor prisms that provide different size plots.
Strip Cruises
Strip cruises are similar to line plot cruises. The difference is instead of taking circular plots, the forester tallies all the trees along the line within a 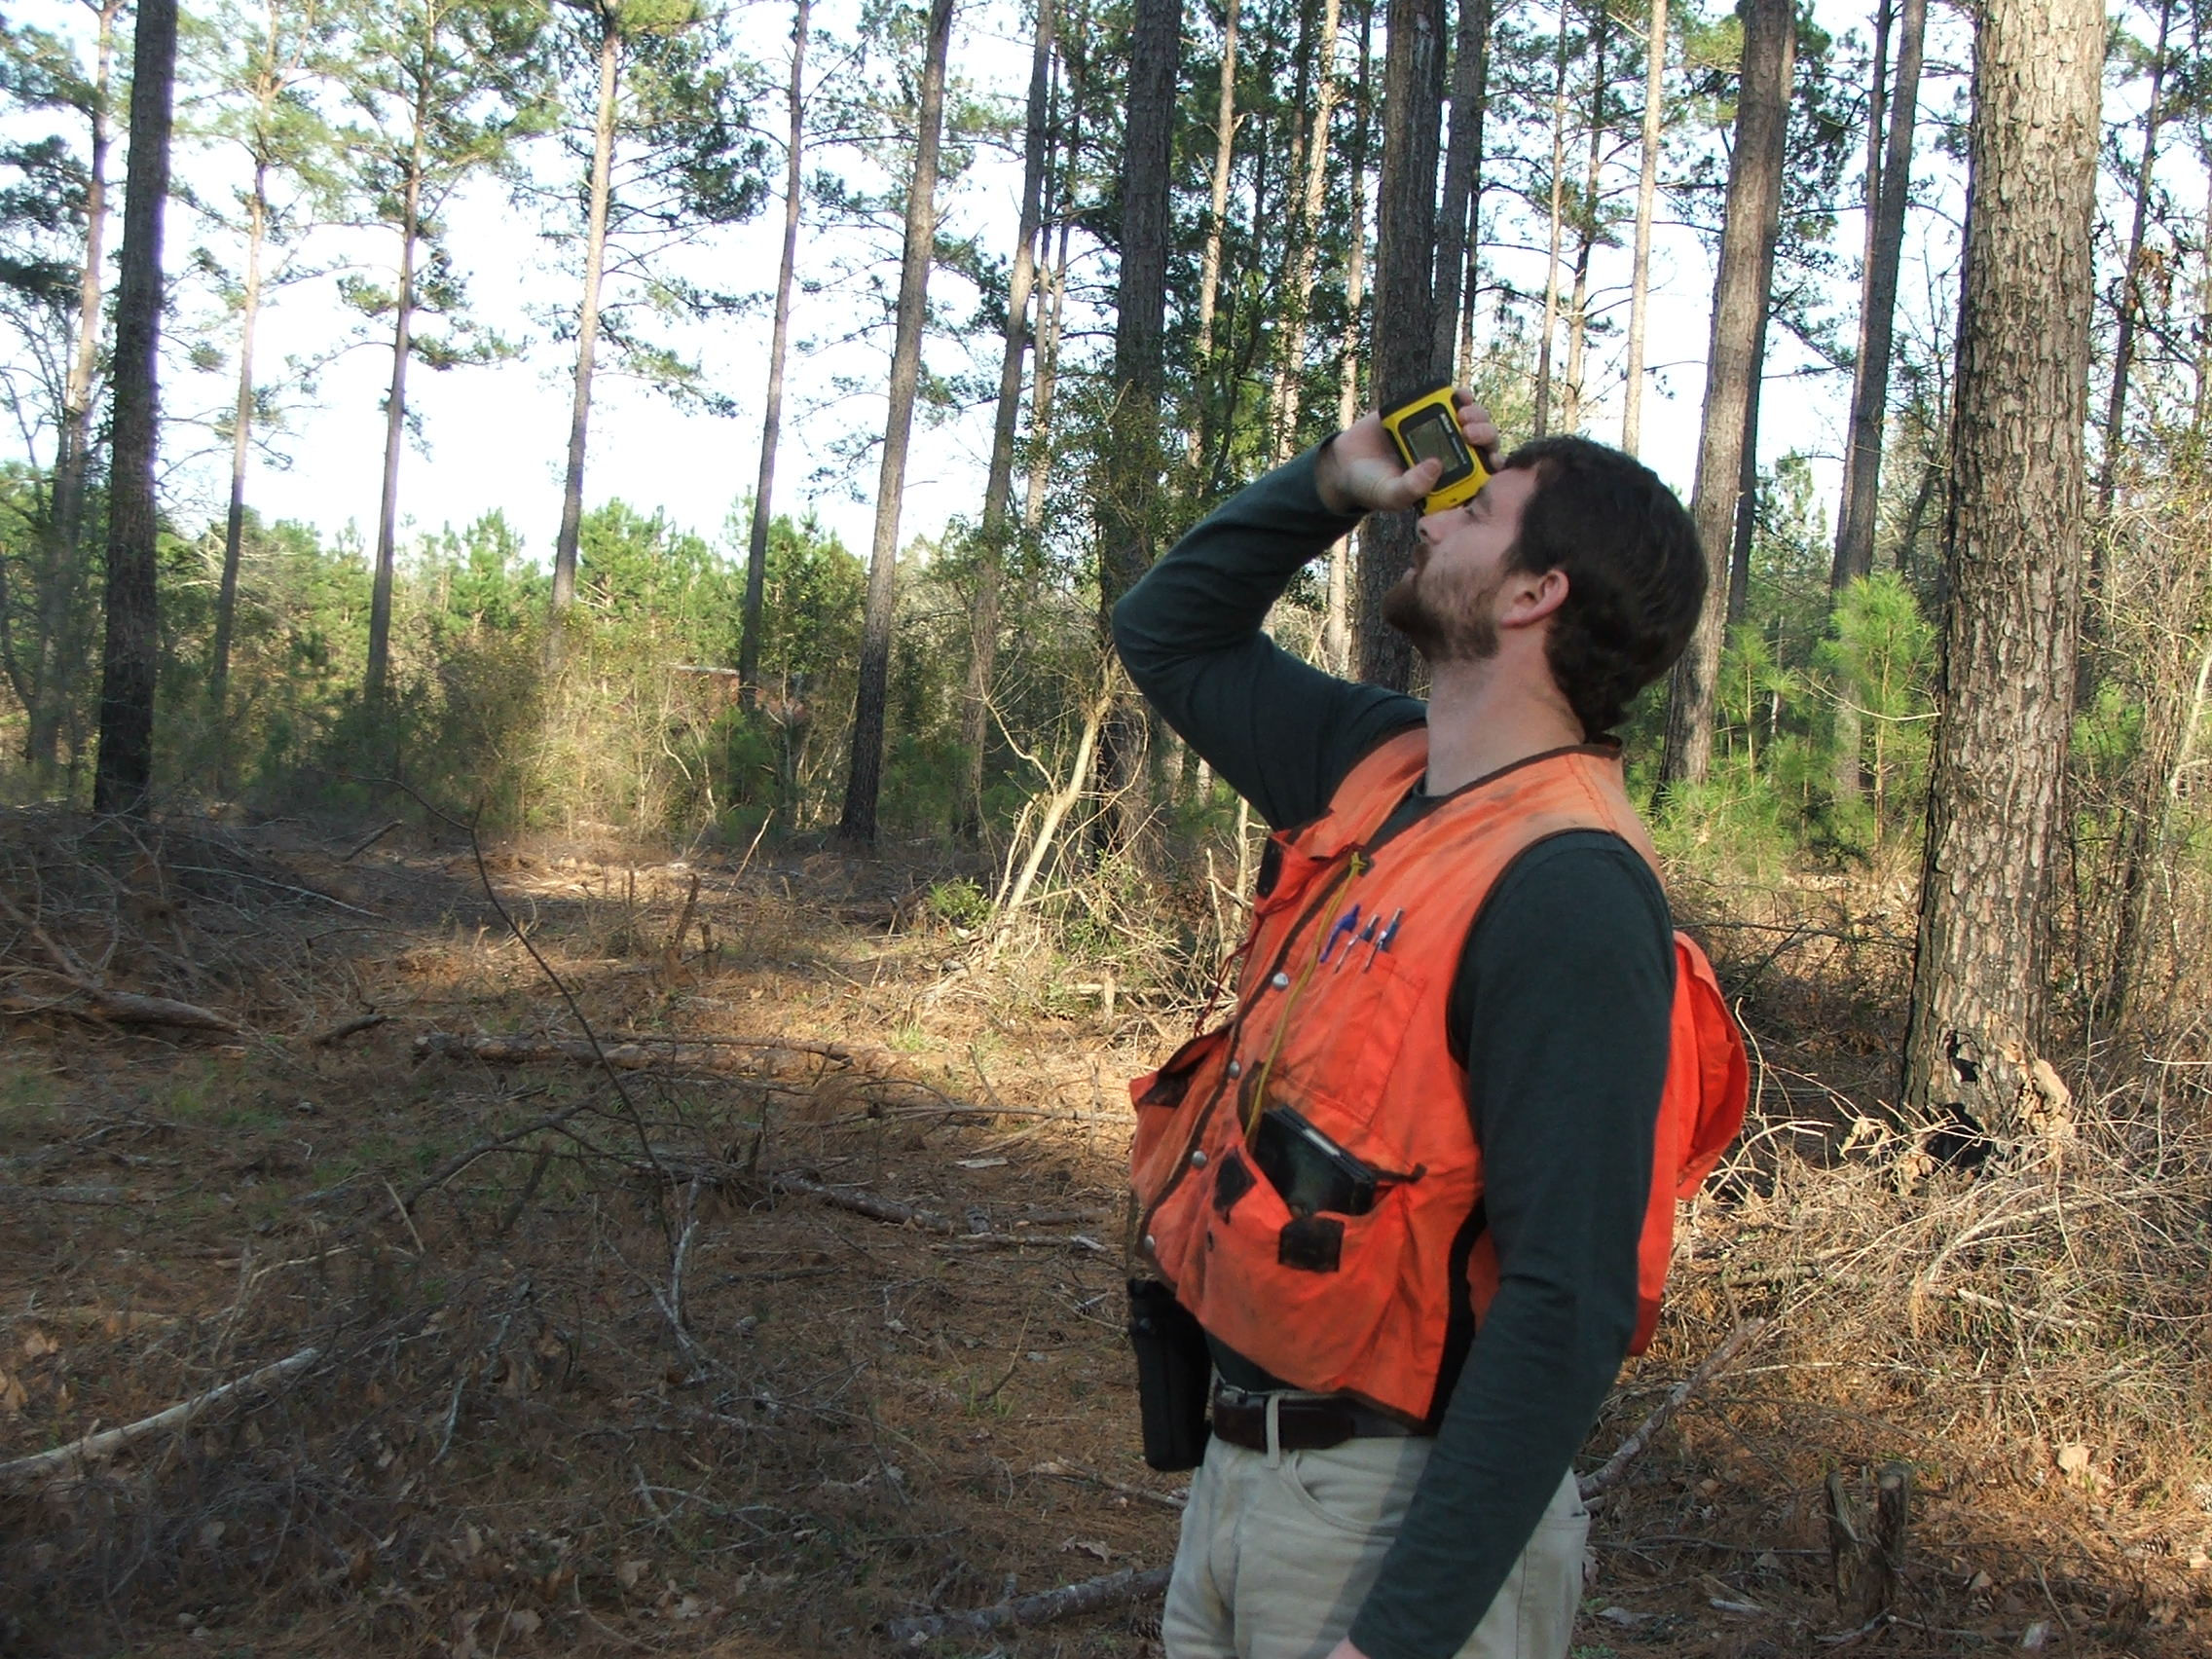 chain wide strip. The strip may be wider or narrower depending on the intensity of the cruise. This is a very old method of inventorying and is very accurate. Strip cruises in hardwood drains are very common. The strip is measured with a log tape to be sure of the distance similar to measuring the plot radius. Trees are measured and tallied the same as you would on plot cruises by taking species, DBH, height and quality data.
The forester will probably map out the timber stand while chaining through the stand. This will enable him/her to create a stand map with ridges, streams, sloughs, timber variations, old roads and many other features in the stand that may be relevant. The object is to gather whatever information there is to help maximize returns. A good stand-type map of a river bottom can be used to delineate logging roads, wetlands and buffer zones along creeks which would reduce logging costs, which in turn could add to the final value of a timber sale.
100% Cruises
Tallying all the trees on a tract is called a 100% timber inventory. This is usually done on smaller high value timber stands. The stand may not be conducive to another type of cruise and a 100% cruise may be the only way to get an accurate evaluation of the timber volume. The trees are tallied the same way on the tally sheet by measuring species, DBH, height and quality.
Combining Cruise Types
There have been several occasions when we have done a combination of the different types of cruises. This was caused be irregular shape or variations in the density of the timber in the stand. It is the professional forester’s responsibility to be sure that he/she accurately estimates the timber volume and does not perform a less than perfect inventory. Even though timber inventory is an estimate or a sample, the inventory usually is within a few percent of the actual volume. The price applied to the volume inventoried can be very close and we have seen the price fluctuate widely.
Determining Acreage
Measuring the correct acreage is also critical. The total acreage is used in determining the percent cruise and the factor used to expand or “blow up” the cruise. There are several ways of determining the total acres in a tract. The one and only true way is to actually survey the tract, which would be cost prohibitive.
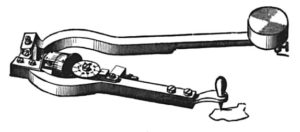
The alternative methods are to planimeter the boundaries on a good map, use a dot grid, use a GPS system or pace the stand while cruising. If the scale is known and the maps are actually to scale, you can use a planimeter to derive the total acres. A planimeter is a devise designed to move around a designated boundary to determine the acreage within the boundary.
Then the numbers are taken from the planimeter and multiplied by the constant giving you the acreage. This is usually done several times and an average is used. A dot grid can be laid over the same map. The dots are counted and multiplied by the constant providing the total acreage.
The global positioning system takes satellite readings at the various corners and computes the acreage. These systems are still very expensive to receive the degree of accuracy needed for forestry. Another way to determine acreage is to count the squares on the cruise map.
When the forester paces of the chains, he/she is also measuring the tract. The graph paper has 10 squares per inch representing a 660 feet per inch grid. One square inch equals 10 acres or one small square equals 1/100th of an acre. We can also use mapping software to generate acres with fairly good accuracy.
After the data has been recorded, it is time to work up the cruise or inventory. The data from the tally cards or data recorder is transferred into a computer program. We have designed a program of our own on an excel spreadsheet. It is possible to compute the outcome by hand, but it is time consuming and there is great opportunity for error.
The computer program is very quick, accurate, and the final form can be printed out. It provides a stand table of the inventoried timber showing the number of trees by height, diameter, species and product. We like to provide this table to timber buyers when we sell timber so the timber buyers will have an idea of what we have to offer. We do not give any idea of what we think the value is. That figure remains between Green Hill Land & Timber and the seller/landowner.
Calculating % Cruise, Blow Up Factor and Total number of Trees
The number of acres in the tract are entered along with the number of acres actually cruised. The actual acres cruised are the summation of all the plots or strips taken. For example if we took ten 1/10th acre plots, we would have cruised one acre. If we took five 1/5th acre plots, we would have cruised one acre. To determine the percent cruise on the tract, you divide the number of acres cruised by the total acres in the tract. If we cruised 1 acre of sample and there are 10 acres in the tract, we have done a 10% cruise. If we cruised 2 acres of sample on a ten acre tract, we have done a 20% inventory.
Understanding that most inventories are a random sample of the timber, the actual volume is determined by increasing the sample or data tallied by a certain factor. The factor that is used to increase or blow up the sample is determined by dividing the percent cruise into 1. For example if we did a 20
percent cruise, we would take 1 divided by .2 = 5. Five would be the constant and for every tree we tallied, theoretically there would be five more trees just like it if we conducted a 20% cruise. If we did a 10% cruise, we would take 1 divided by .1 = 10 and each tree would be multiplied by a factor of 10. On the spreadsheet we enter the actual trees tallied, number of acres cruised and the total acres. After this data is entered the % cruise and blow up factor is computed and the total number of trees on the tract are computed for each DBH, height, species and product.
The total volumes are copied to the next page and placed in the various product categories. At this point, we need to enter the current values for the various products. The prices are derived from comparable sales conducted by the forester, Timber Mart South (a publication of stumpage & delivered timber prices by UGA) or from local producers.
It is very important to use a forester that is current with the timber market as timber prices can fluctuate considerably. At this point the timber volumes have been multiplied by the current timber prices providing you with the current value of the timber on your stand.
As you can see, there is quite a bit of training and thought that goes into getting an accurate timber inventory. We can usually look at a tract and get a good idea of the volume and value but nothing takes the place of the timber inventory. This process, done correctly, is very accurate and gives us the information we need to make sound knowledgeable decisions.
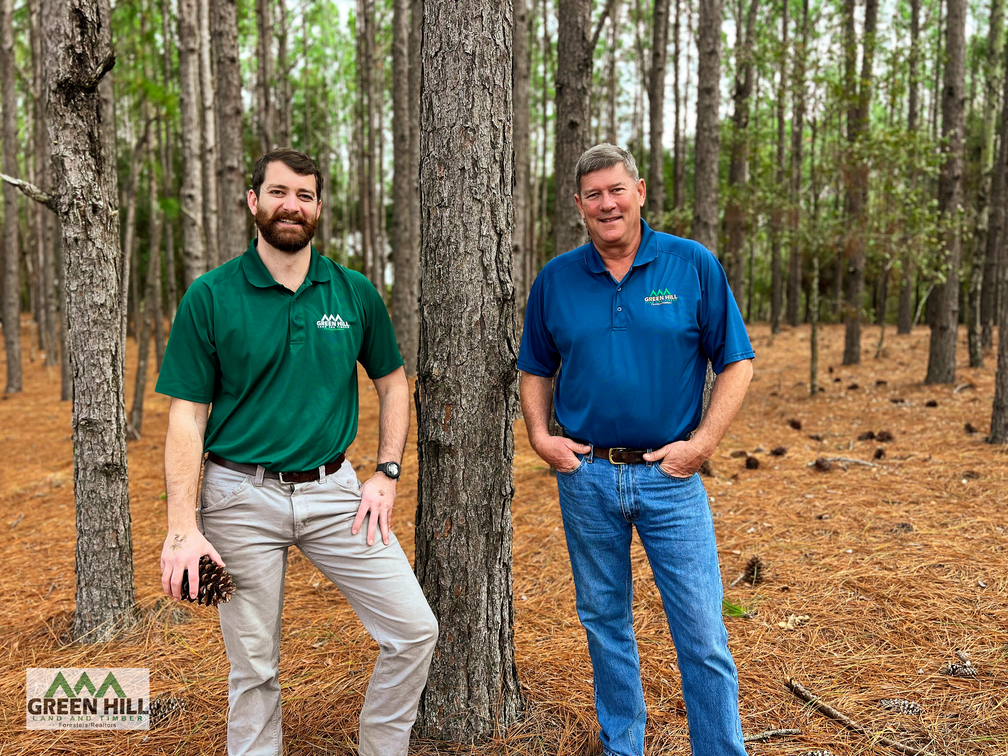
 Land.com recognizes Jack Frankhouser as a top producer in the Southeast. Jack's hard work, expertise, and professionalism has helped many people with their land.